Strength and weaknesses: A comparison of Beijing with four Bemajor metropolises
- By Zhou Muzhi
 0 Comment(s)
 Print
Print E-mail China.org.cn, August 15, 2022
Editor's Note:
In the future, an important goal of Chinese first-tier cities will be to join the ranks of the New York city, London, Tokyo and Paris to become a major metropolis. As the national capital city as well as the country's political, cultural, technology and economic center, Beijing tops the comprehensive ranking of the China Integrated City Index (CICI) for years. Looking into the future, Beijing should avoid complacency and strive for greater development as it bridges the gap with the four major metropolises. Professor Zhou Muzhi, head of Cloud River Urban Research Institute, uses the latest results of satellite data parsing and geographic information system (GIS) analysis to compare Beijing with New York, London, Tokyo and Paris in terms of their populations and economic development, offering a detailed outlook on the future of Beijing and other Chinese cities in general.
As the national capital city as well as the country's political, cultural, technology and economic center, Beijing tops the comprehensive ranking of the China Integrated City Index (CICI) for years. Looking into the future, Beijing should avoid complacency and strive for greater development as it bridges the gap with the four major metropolises.
New York, London, Tokyo and Paris are universally recognized as the world's four major metropolises, the hub of global economic and cultural exchanges and the benchmark for urban development. Therefore, it is essential to make a comparative study between Beijing and the four major metropolises in order to identify the Chinese capital's strength and weaknesses.
However, the four major metropolises have all spread out beyond the boundaries of cities in actual form into megalopolises, which makes our quantitative analysis even harder. Through years of efforts facilitated by satellite data parsing and GIS analysis, Cloud River Urban Research Institute can accurately determine the scope of these megalopolises, and precisely analyze their population size, distribution, and density. The institute can also measure the development quality of a megalopolis through a multimodal index analysis, elevating the research on metropolises worldwide to a new level. This has provided a scientific basis for the accurate comparative analysis of Beijing and the four major metropolises.
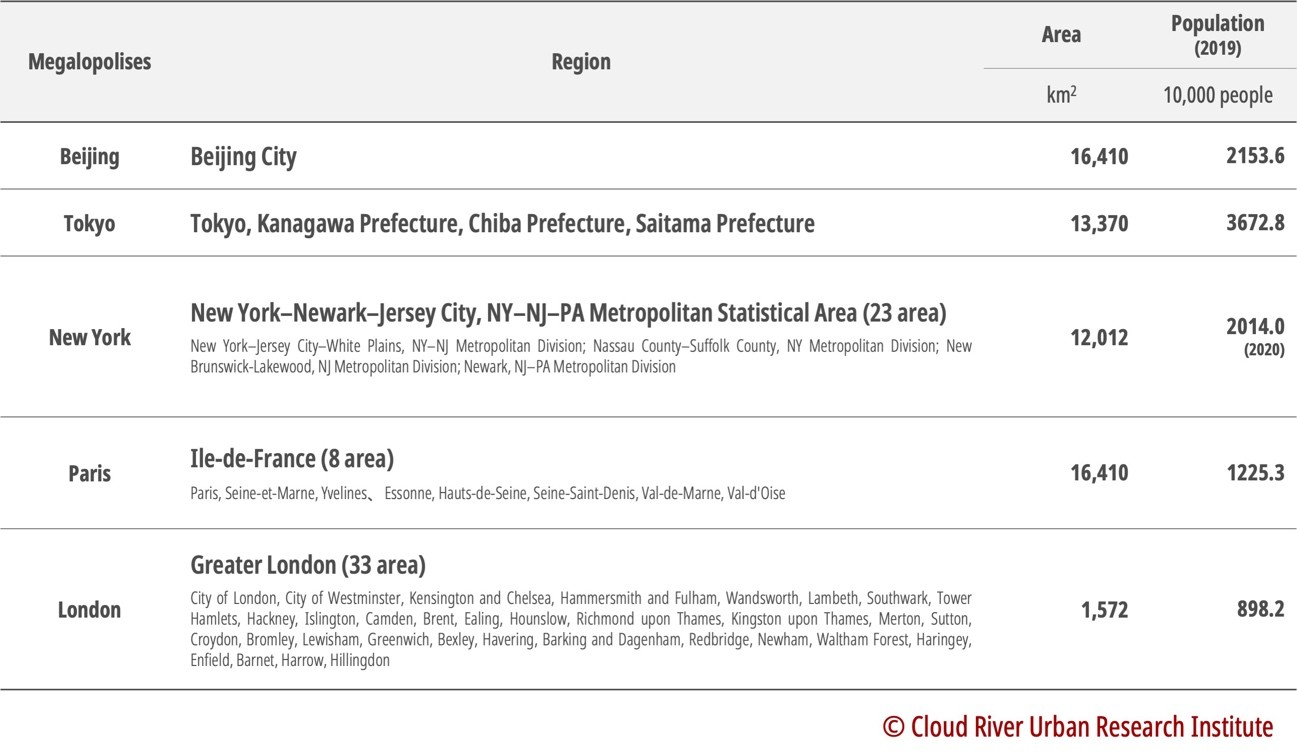
Table 1. The size and population of Beijing, New York, London, Tokyo, and Paris megalopolises
1. Population: China's population grew by 58.7% in the past 20 years
As Figure 1 shows, Cloud River Urban Research Institute defines the area with more than 5,000 people per square kilometer as a Dense Population District (DID). This helps analyze a city's population density and identify the boundary of a megalopolis. In this article, statistics about New York, London, Tokyo and Paris are measured within the boundaries of each megalopolis.
Figure 1. DID within the boundaries of New York, London, Tokyo and Paris
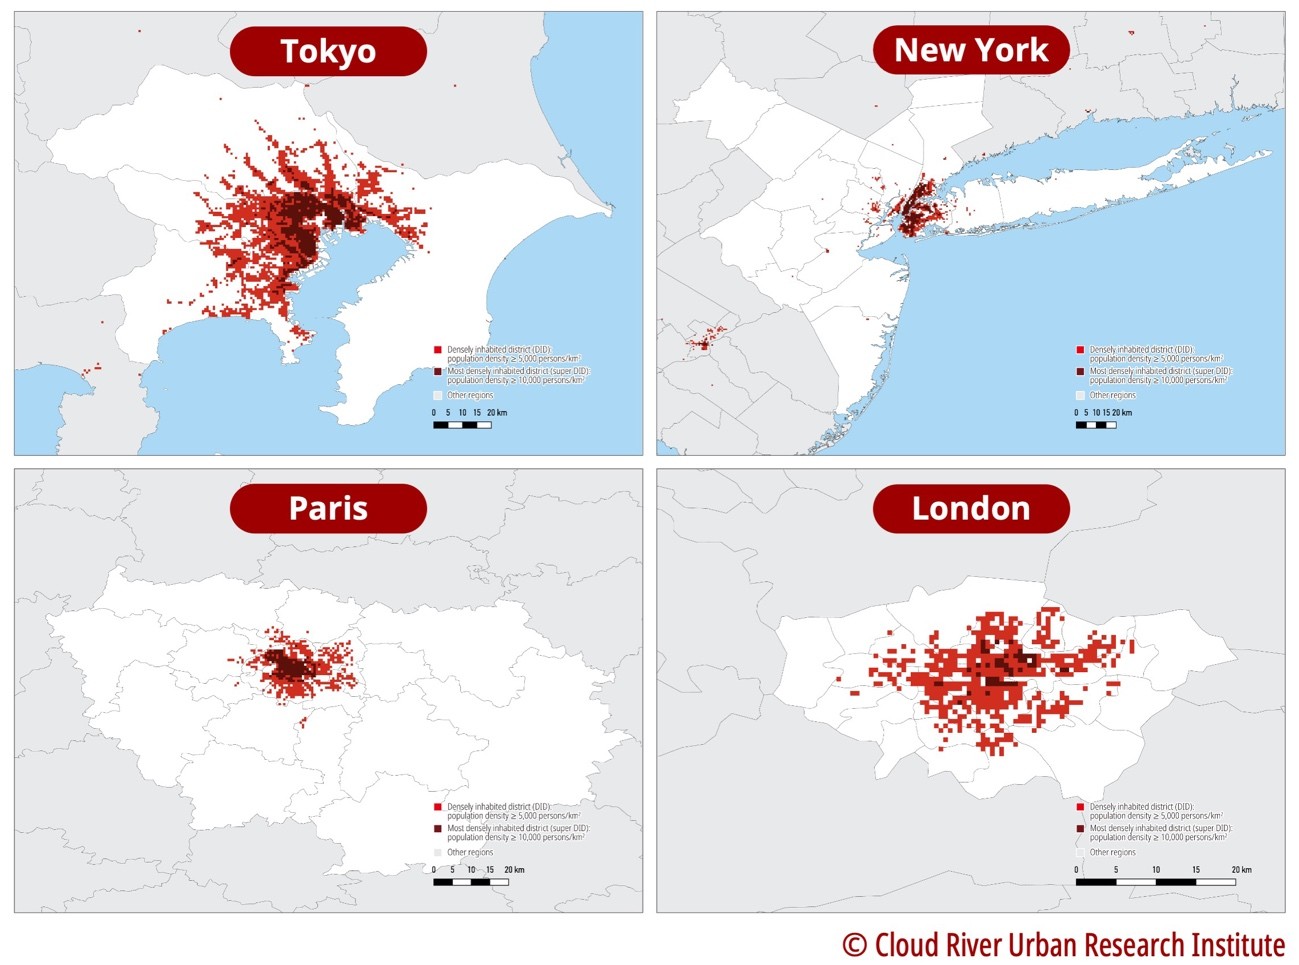
Note: Please refer to Table 1 for the boundaries of the four megalopolises.
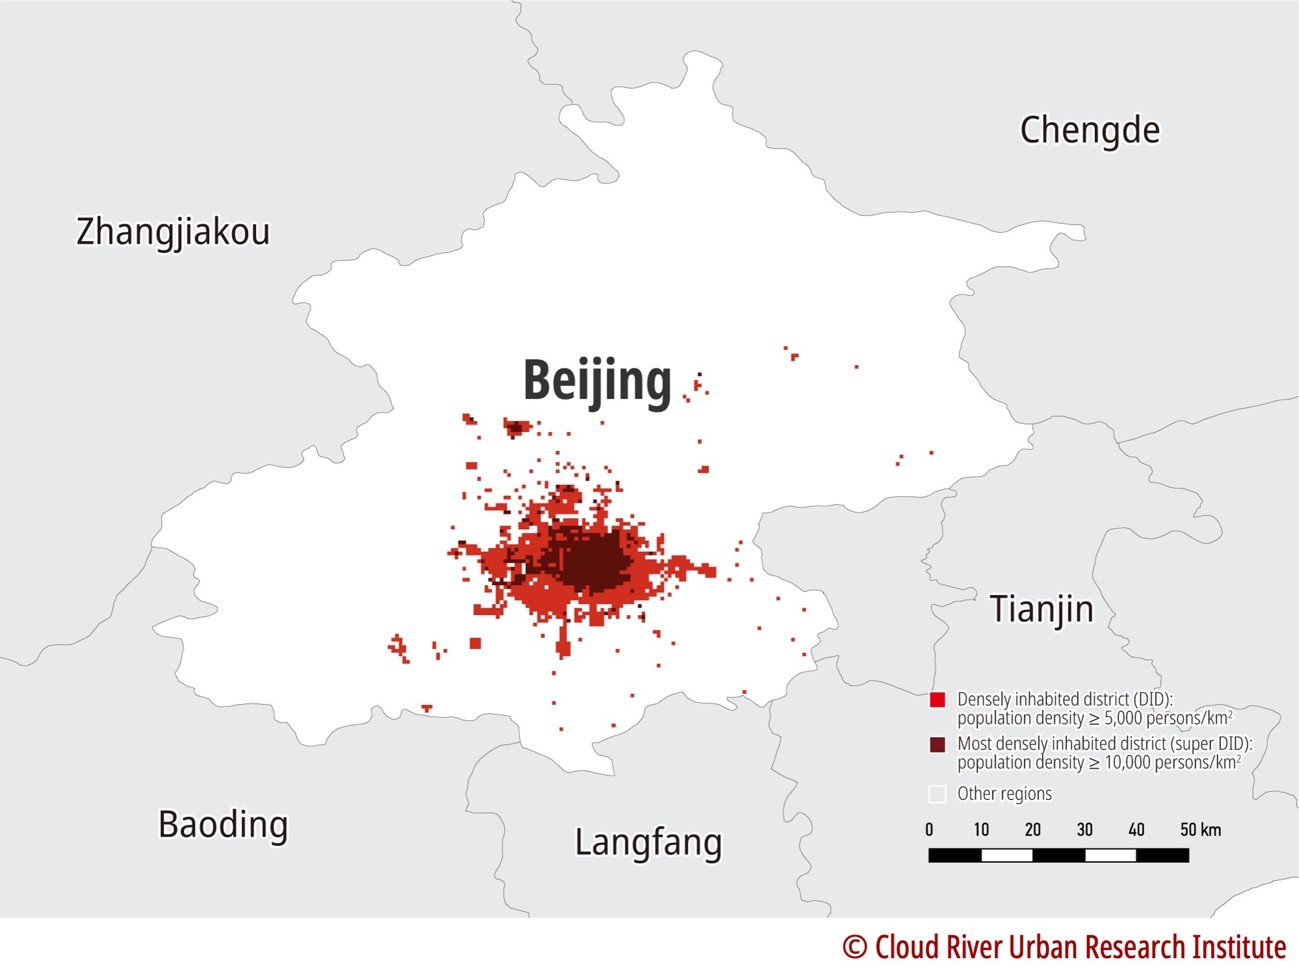
As Figure 2 suggests, the Beijing megalopolis according to the DID analysis is within the administrative region of the city. Therefore, the statistics about Beijing megalopolis mentioned in this article come from the statistics of the Beijing municipality.
Figure 2. DID analysis of the Beijing megalopolis
(1) Metropolis with the largest population
The Tokyo megalopolis is the world's most densely populated city with a population of 36.73 million in 2019, or 1.7 times that of Beijing's total population. The New York megalopolis has a population about 93.5% that of Beijing. Paris and London megalopolises have only 56.9% and 41.7% of Beijing's population.
Figure 3. A comparison of Beijing with the four major metropolises in terms of population (2019)

(2) Population continues to concentrate in major metropolises
Beijing leads in population growth among the five cities. From 2000 to 2019, Beijing's population grew by 58.7% driven by the high-speed economic growth and urbanization of the country.
Among the four metropolises, London enjoys the fastest population growth, recording a 24.8% increase in the past 20 years. Over the same period, Paris, Tokyo and New York megalopolises recorded 10.4%, 9.9% and 9.9% growth in population, respectively. This has shown that the population continues to concentrate in major metropolises worldwide, and the logic applies to developed countries as well.
Figure 4. A comparison of Beijing with the four major metropolises in terms of population growth (2000-2019)

(3) The difference in population concentration
The population of the Tokyo megalopolis accounts for up to 29% of Japan's total population, the highest among the four metropolises. The population concentration in the Tokyo megalopolis has become Japan's biggest demographic feature.
Around 18.8% of the 65.13 million French are concentrated in the Paris megalopolis, while 13.3% of the 67.53 million British are concentrated in the London megalopolis.
In contrast, the population in the New York megalopolis only accounts for 6.1% of the U.S. population, which mirrors the demographic structure of a country with 329.07 million people.
In the world's most populous country, the population is decentralized, concentrating in megacities around China. Although Beijing has a population of up to 21.54 million, it only accounts for 1.5% of the country's total.
Figure 5. A comparison of Beijing with four major metropolises in terms of the proportion of its population in the country (2019)

2. Economic scale: Beijing grew by 13.3-fold over 20 years
Economic vitality is the biggest driver for population concentration. Although Beijing witnessed rapid economic growth in the past 20 years, its economic scale and its ability to draw global resources still lag behind the four major metropolises.
(1) Which city boasts the world's biggest economic scope?
In 2019 before the COVID-19 outbreak struck the world, New York megalopolis had the largest GDP among the five cities, or 3.7 times that of Beijing. The second was the Tokyo megalopolis, whose economic scale was 3.3 times of Beijing's. The GDP of Paris and London megalopolises were 1.7 times and 1.3 times that of Beijing, respectively. This indicates that there is still a gap between Beijing and the four major metropolises in terms of economic scale.
Figure 6. A comparison of Beijing with the four major metropolises in terms of economic scale (2019)

(2) Beijing's economic volume grew by 13.3 times over the past 20 years
However, Beijing tops among the five metropolises in terms of economic growth rate. From 2000 to 2019, Beijing's economic scale grew by 13.3 times, an economic miracle driven by the rapid development of the country. Over the same period, the New York megalopolis has saw its GDP doubled, making it the fastest-growing city among the four major metropolises. The economic scale of London, Paris and Tokyo megalopolises increased by 56%, 34% and 12%.
Figure 7. A comparison of Beijing with the four major metropolises in terms of economic growth (2000-2019)

(3) Contribution to the overall national economy
In 2019, the economic volume of the Tokyo megalopolis accounted for 33.1% of the national economy, ranking first among the five cities, followed by Paris's 32.4% and London's 23.6%. This has shown that Japan, France and the U.K. highly concentrate their economy in the capital economic circle.
The New York megalopolis contributes 8.8% to the U.S. economy, which is the lowest among the four metropolises because the country's economy is more decentralized due to the large size of its territory and population. Although it boasts larger economic volume compared to other cities, the New York city only accounts for less than 10% of the economy.
Beijing only accounts for 3.6% of the national GDP partly due to the similar reason that the country's economy is more decentralized and its territory and population is bigger than others. It also reflects that Beijing still lags behind major metropolises in its ability to pool global resources.
Figure 8. A comparison of Beijing with the four major metropolises in terms of their contribution to the economy (2019)

3. Beijing's per capita GDP grew by 9.8 times over 20 years
Per capita GDP is an important indicator of economic development. Over the past 20 years, Beijing's per capita GDP grew by nearly 10-fold. Today, Beijing's per capita GDP is 2.4 times the national average.
(1) Global metropolis with the largest GDP
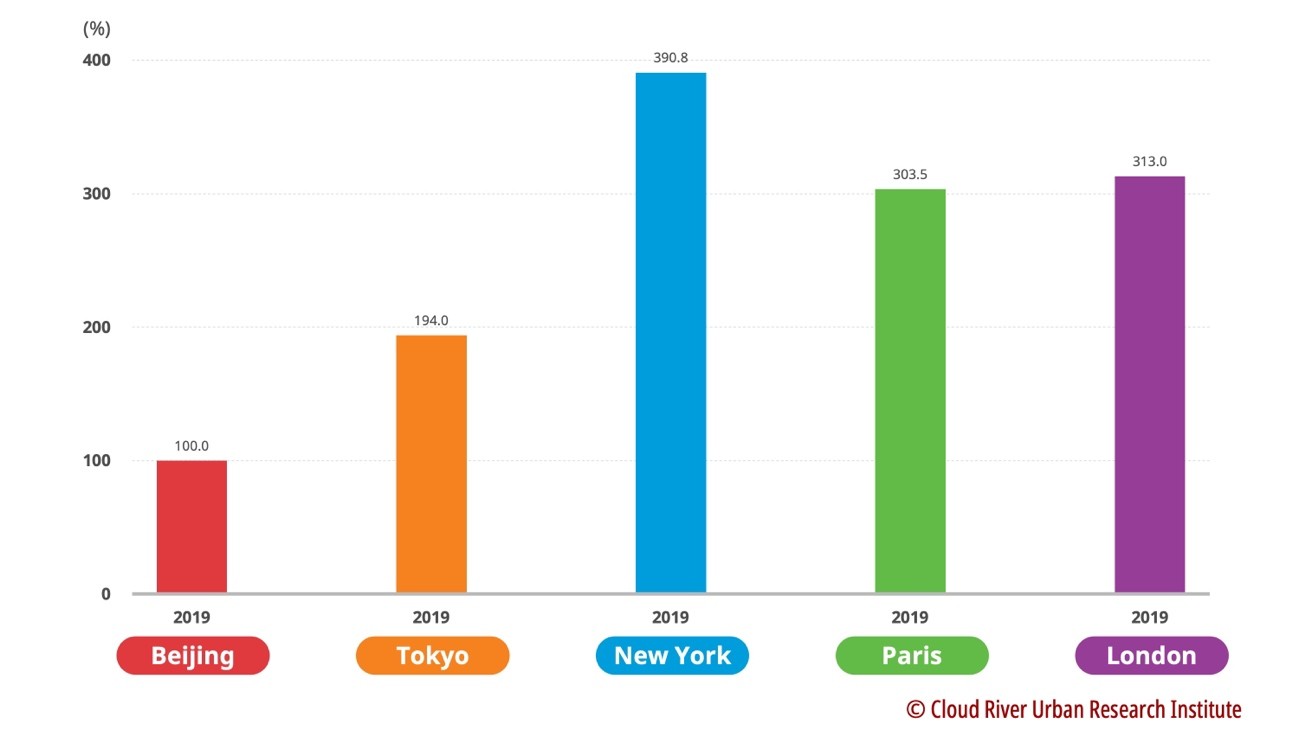
New York has the largest per capita GDP among the four metropolises, or about 3.9 times that of Beijing. The per capita GDP of London and Paris is 3.1 times and 3 times that of Beijing, respectively. Though slightly lower than the other three metropolises, Tokyo's per capita GDP is 1.9 times that of Beijing's.
Figure 9. A comparison of Beijing with the four metropolises in terms of per capita GDP (2019)
(2) The city with the fastest growing per capita GDP
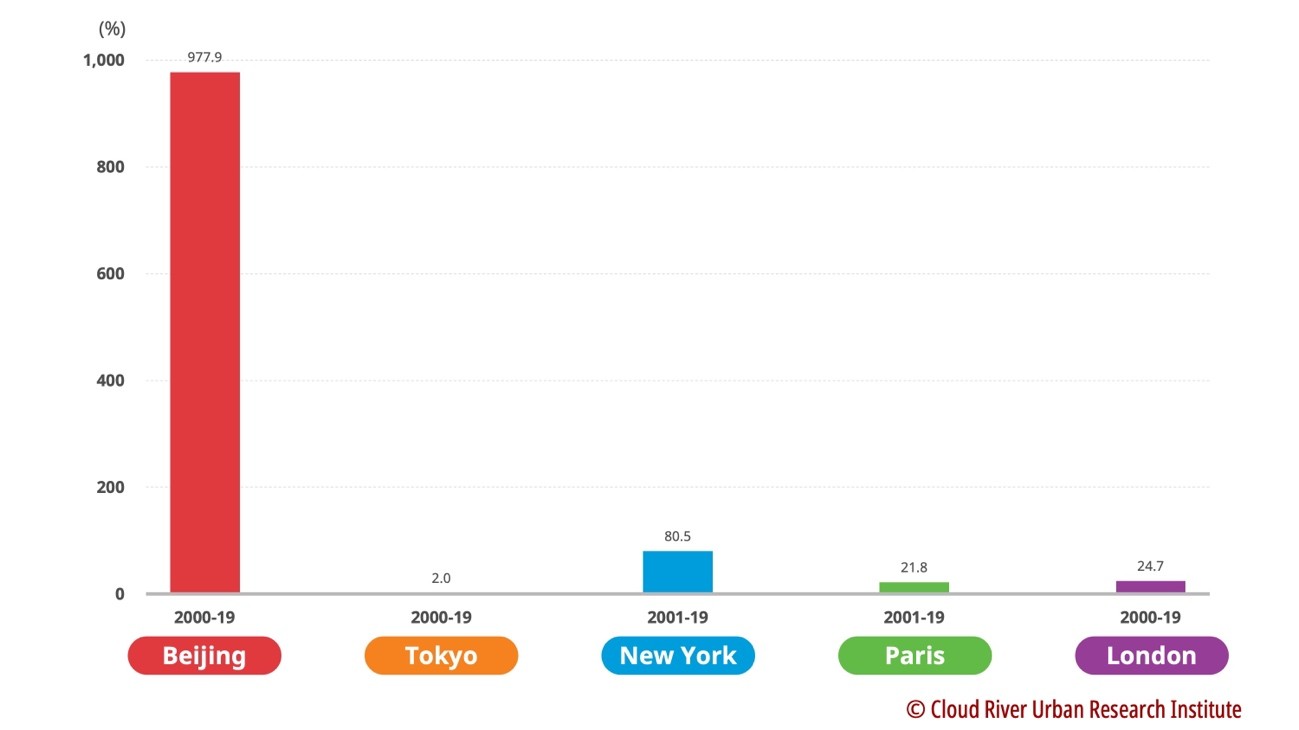
In the past 20 years, Beijing's per capita GDP has grown by 9.8-fold. Thus, the economic wonder that Beijing created is not only reflected on its high-speed growth but on the rise of the per capita GDP.
Among the four major metropolises, New York witnessed the largest growth of 80% in its per capita GDP over the past 20 years. Over the same period, London and Paris recorded 24.7% and 21.8% growth, respectively. The per capita GDP of Tokyo only increased by 2%, which vividly mirrored the economic stagnation that Japan went through after its economic bubble burst.
Figure 10. A comparison of Beijing with the four major metropolises in terms of per capita GDP (2000-2019)
(3) The development gap between metropolises and the rest of the country
Among the four major metropolises, the per capita GDP of London and Paris is 1.8 times and 1.7 times that of each of their national average. The New York city's per capita GDP is 1.4 times that of the U.S. average. The international exchange hub function of the world metropolis, on the one hand, contributes to the vitality and efficiency of its economic development, and on the other, it is also the reason for population gathering.
Tokyo's per capita GDP is only 1.2 times that of the national average, which is the answer to its long-term pursuit of balanced development.
Beijing's per capita GDP is 2.4 times the national average, higher than that of the four major metropolises. On the one hand, this figure reflects the trend of megacities leading China's economic development, and on the other, it also reflects the unbalanced development of China's economy.
Figure 11. A comparison of Beijing with the four major metropolises in terms of their per capita GDP against the national average (2019)

4. Conclusion
From the above analysis, we can conclude that the global population continues to concentrate in megacities. With continued population growth, the development of theses megacities determines the demographic structure of the country.
(1) The population continues to concentrate in megacities
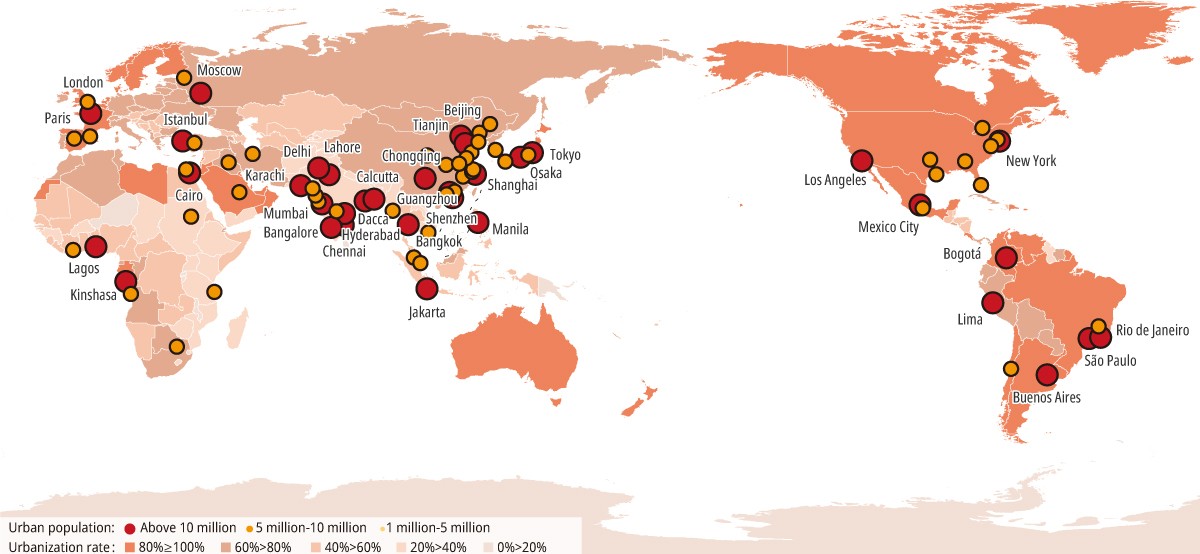
If cities with a population of more than 10 million are defined as megacities, the trend of economic and population concentration in megacities is becoming more and more intense globally.
In 1950, there were only two megalopolises in the world, Tokyo and New York, with a population of more than 10 million. Twenty years later, in 1970, the Osaka megalopolis had been added to the list. However, as urbanization speeds up after 1980, the number of megacities worldwide rose to 34 in 2020, which are home to a total of 560 million citizens, accounting for 16.3% of the global population.
The reason behind was the sudden acceleration of the IT revolution and the globalization process after the 1980s.
Because of this, these megacities have evolved or are evolving into world metropolises with their economies taking off based on international exchanges.
Figure 12. A map of megacities around the world
(2) Economic development of global megacities continues
From the above analysis, world metropolises like New York, London, Tokyo and Paris have continued economic development and population growth in the past 20 years. The reason why these cities can sustain economic growth in developed countries with slow or stagnated economic growth are attributed to the following reasons:
First, these world metropolises are not only international hubs for finance, information and people-to-people exchanges, but also evolve into the center for the digital economy. Economic development based on international exchanges has paved the way for urban economic development under the context of the evolving international landscape.
Second, these world metropolises have successfully resolved or mitigated the problems caused by the concentration of population and increased the city's capacity and density. For example, the Tokyo megalopolis has serious urban diseases when its population hit 10 million but those problems are mitigated today as the population approaches 40 million.
(3) Megacities contribution to the national economy in different countries
In post-war Japan, the high concentration of economy and population in the Tokyo megalopolis has always been regarded as a problem that needs to be overcome by the concerted efforts of the whole country. There are two reasons why Japan needs to devote so much policy efforts to solve the polarization problem:
First, the huge concentration of population in Tokyo has caused serious "urban diseases" in the environment, transportation, housing, living, education, etc.
Second, the continuous inflow of population in Tokyo has made other parts of the country less dynamic.
After decades of efforts, most of the "urban diseases" in the Tokyo megalopolis has been mitigated or resolved, but the population outflow from other areas of Japan remains a major concern for economic inertia in the regional economy. The U.K. and France have similar demographic problems.
On the contrary, China and the U.S., because of their vast territory and large populations, have many megacities around the country. The multi-polarization of population and the economy help rebalance their demographic structures. Therefore, it is essential for China to implement an urbanization policy combining large urban agglomerations with megalopolises in order to form a healthy demographic structure in the country.
(Researchers at Cloud River Urban Research Institute Kurimoto Kenichi, Zhen Xuehua, and Zhao Jian contributed to data compilation and graphic production in the article.)


