The quality and safety of food is a major benchmark of the economic development and people's living conditions of a country. Adhering to the people-oriented approach, the Chinese government has always attached great importance to food quality and safety. Moreover, sticking to the principle of nipping problems in the bud, it has built and improved a supervisory system and mechanism for food safety, strengthened legislation and the setting of relevant standards, exercised strict quality control regarding food, actively promoted international exchanges and cooperation in this respect, and has greatly raised public awareness of food safety. Thanks to such efforts, the overall level of food quality in China is being steadily enhanced, the situation of food safety is continuously improving, and the order in food production and operation have markedly turned for the better.
I. Food Production and Food Quality
1. The Quality and Safety Level of Processed Food Is Steadily Improving
(1) Rapid and Sound Development of the Food-processing Industry
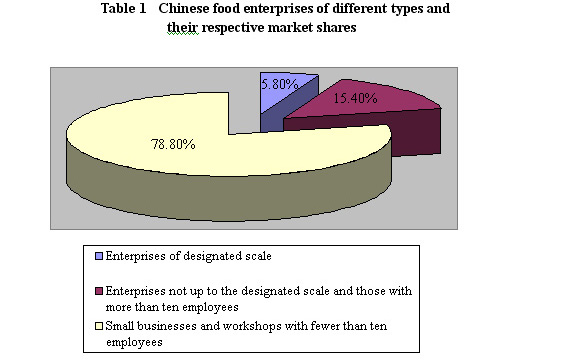
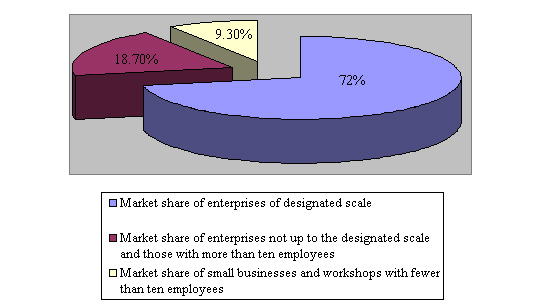
In recent years, China's food industry has maintained fast and sound growth, with a steady increase in economic benefits. Foodstuffs can be classified by their raw materials and processing techniques into 525 kinds in 28 categories: processed grain products; edible oil, fat and fat products; seasonings; meat products; dairy products; soft drinks; convenient food; biscuits; canned food; iced drinks; fast-frozen food; potato and dilated food; candies (including chocolate and chocolate products); tea; alcoholic beverages; vegetable products; fruit products; roasted seeds and nuts; egg products; cocoa and bakery coffee products; sugar; processed aquatic products; starch and starch products; pastries; bean products; bee products; special diet food, and others. At present, China has 448,000 enterprises engaged in foodstuff production and processing. Among them, 26,000 enterprises of designated scale 1 occupy 72 percent of the market, taking the leading role in terms of output and sales revenue; 69,000 are enterprises not up to the designated scale and those with more than ten employees, taking up a market share of 18.7 percent; and 353,000 are small businesses or workshops with fewer than ten employees, with a market share of 9.3 percent. (See Table 1)
1 Refering to private industrial enterprises with annual revenue of two million yuan or more and all state-owned industrial enterprises, as well as private commercial enterprises with annual revenue of five million yuan or more and all state-owned commercial enterprises. — Tr.
 |
 |
Statistics show that, in 2006, industrial food enterprises of designated scale generated 2,158.695 billion yuan of output value (excluding tobacco), accounting for 6.8 percent of the national industrial output value, and up 23.5 percent year on year. The average annual industrial added value and profit of processing enterprises of grain, oil, meat and dairy products all exceeded 20 percent. The output of major foodstuffs in 2006 were: wheat flour, 51.93 million tons; edible vegetable oil, 19.855 million tons; fresh frozen meat, 11.125 million tons; dairy products, 14.596 million tons; beer, 35.152 million kl; and soft drinks, 42.198 million tons. These figures show rises of 28.2 percent, 17.5 percent, 24.0 percent, 23.5 percent, 14.7 percent and 21.5 percent year on year, respectively. In the first six months of 2007, the accumulated output value of the food industry amounted to 1,281.62 billion yuan, up 29.9 percent as compared with the corresponding period last year. The output of beer, edible oil, soft drinks and gourmet powder led the world.
At present, the development of China's food industry displays the following features:
One, the processing techniques and equipment of some food enterprises reach or approach the advanced international level. Large meat, dairy product, beverage and beer producers all have world first-class production and testing facilities, which guarantees the quality of their products. The development and application of such key processing techniques as membrane-separation technology, physical property modification, cold-aseptic filling, concentration and cold processing has narrowed China's gap with the world advanced level in terms of processing technology and equipment.
Two, quality control of the enterprises has become more scientific and standard. So far, 107,000 food producers have obtained market access permits regarding quality and safety, and 2,675 have been granted hazard analysis and critical control point (HACCP) certificates.
Three, the structure of products is being improved to cater to the increasingly diverse demands of consumers. The proportion of intensively or deeply processed foodstuffs to the total output of foodstuffs keeps increasing. For instance, liquid dairies now account for more than 85 percent of the total output of dairy products; colas no longer dominate the market, as a result of the mushrooming of packed drinking water and fruit, vegetable and tea drinks; special flour above second grade accounts for 65 percent of the total output of wheat flour; standard rice above first grade accounts for 88 percent of the total output of rice, and special rice for 33.9 percent of the total output of rice; and Grades I and II oil (salad oil and quality culinary oil according to previous national standards) accounts for 58.5 percent of the total output of edible vegetable oil.
(2) Continuous Improvement of Food Quality
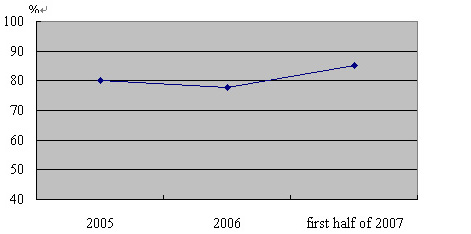
One, the acceptance rate of foodstuffs on the whole is steadily rising. The rate was 77.9 percent in the 2006 national foodstuffs sample survey, and it rose to 85.1 percent in a similar survey in the first half of 2007. The level of food quality and safety remains stable, with a gradual upturn. (See Table 2)
Table 2 Acceptance rate of foodstuffs in sample surveys from 2005 to June 2007
|
Two, the quality of food produced nationwide is improving. In the first half of 2007, the 31 provinces, autonomous regions and municipalities directly under the Central Government on the mainland of China reported an average 89.2-percent acceptance rate of foodstuffs, and the figure in 14 of them surpassed 90 percent.
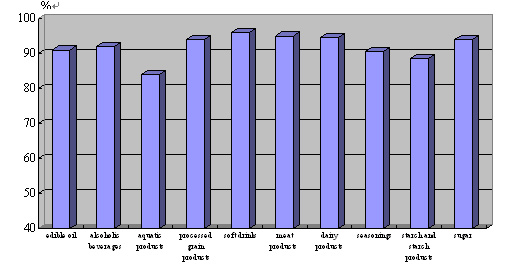
Three, the quality of food in key sectors is fairly high. Thanks to the country's endeavors to improve the work of food producers and processors, the quality of 525 kinds of foodstuffs in 28 categories has been enhanced to various degrees, with remarkable progress in the quality of food with a large daily consumption. According to statistics, the ten foodstuffs with the largest consumption are edible oil, fat and fat products; alcoholic beverages; aquatic products; processed grain products; soft drinks; meat products; dairy products; seasonings; starch and starch products; and sugar. In the first half of 2007, sample surveys showed a 90-percent or higher acceptance rate of all the above ten foodstuffs except aquatic products, whose acceptance rate was 85 percent. That of meat products was 97.6 percent. (See Table 3)
Table 3 Acceptance rate of the ten most-consumed foodstuffs in the first half of 2007
|
(3) Quality Food Dominating the Market
Along with the development of the food industry, the scale of food producers keeps growing, production is becoming more concentrated, and the quality of foodstuffs of large and medium-sized producers is sound. In 2006, the top 100 revenue earners held 24.9 percent of the total sales of the food industry; the top ten dairy producers generated 54.7 percent of the total revenue of the dairy industry; the top ten soft-drink producers generated 39.5 percent of the total output of that industry; the top ten sugar makers produced 43.6 percent of the total output of the sugar industry; the top 50 meat producers accounted for 70 percent of that industry in terms of production capacity and sales; the eight beer brewery groups, each with a production capacity of over one million kl, produced 57 percent of the national beer output; the ten largest wineries produced 62.1 percent of the national output; and the three largest instant noodle producers occupied 76 percent of the Chinese market.
2. The Quality and Safety of Agricultural Products Is Steadily Improving
(1) Fast Growth of High-quality and Safe Brands
Quality agricultural products are steadily expanding their market. Agricultural standardization has been notably enhanced, which increases farmers' income and changes their farming patterns. Hazard-free, green and organic products make up 90 percent of all agricultural-product exports. Over the past five years, the export of green food has shot up 40 percent annually, and has been accepted by over 40 of China's trading partners. So far, China has developed 28,600 kinds of hazard-free agricultural products, and set up 24,600 hazard-free production bases with a total area of 21.07 million hectares. Five thousand three hundred and fifteen Chinese enterprises use the green food logo on their 14,339 kinds of products totaling 72 million tons and grown on 10 million hectares of land. In addition, 600 producers use the organic food logo on their 2,647 kinds of products totaling 19.56 million tons and grown on 3.11 million hectares of land. Altogether, there are 539 state-level agricultural demonstration zones, 100 demonstration counties (farms) and nearly 3,500 provincial-level demonstration zones, with a combined growing area exceeding 33.33 million hectares.
(2) Acceptance Rate of Agricultural Products Rising Continuously
Inspections in the first half of 2007 showed that the average acceptance rate regarding pesticide residues in vegetables was 93.6 percent; those regarding clenbuterol hydrochloride contamination and sulfa drug residues in livestock products was 98.8 percent and 99.0 percent respectively; and that regarding chloromycetin in aquatic products was 99.6 percent, of nitrofuran 91.4 percent, and of pesticide residue over 95 percent in sample surveys done at production bases.
3. The Quality of Imported and Exported Foodstuffs Stays High
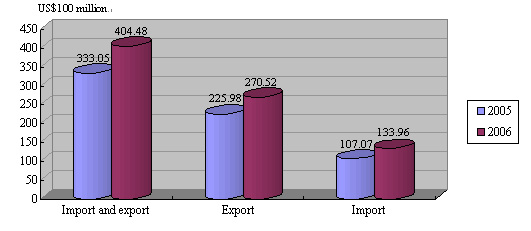
China is a large importer and exporter of foodstuffs, with the amount of each growing steadily in recent years. The import and export volume in 2006 totaled US$40.448 billion-worth (excluding wheat, corn and soybean, same below), up 21.45 percent year on year. (See Table 4)
Table 4 China's food import and export volumes in 2005 and 2006
 |
(1) Safety of Export Food Guaranteed
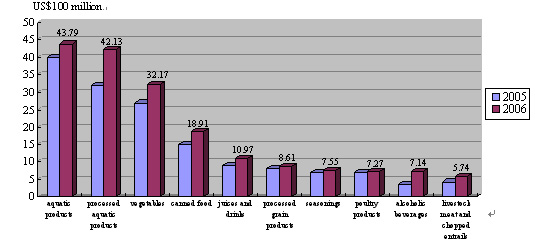
In 2006, China exported 24.173 million tons of food, worth US$26.659 billion, up 13.29 percent and 16.0 percent year on year, respectively. The top ten varieties in terms of export value were aquatic products, processed aquatic products, vegetables, canned food, juices and drinks, processed grain products, seasonings, poultry products, alcoholic beverages, and livestock meat and chopped entrails. (See Table 5)
Table 5 Top ten food varieties in terms of export value in 2006 as compared with 2005
 |
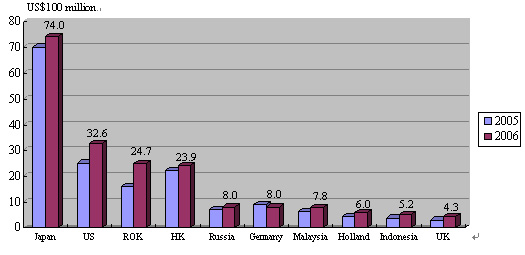
Foodstuffs of the mainland of China have been exported to more than 200 countries and regions, of which the top ten in terms of trade volume are Japan, the US, the ROK, Hong Kong, Russia, Germany, Malaysia, Holland, Indonesia and the UK. (See Table 6)
Table 6 Top ten countries and region in terms of China's export value of food in 2006 as compared with 2005
 |
For many years, over 99 percent of China's exported foodstuffs have been up to standard. In 2006 and the first half of 2007, China exported to the US some 94,000 batches and 55,000 batches of foodstuffs, respectively, and 752 batches and 477 batches of each were found by the US to be substandard, making the acceptance rate 99.2 percent and 99.1 percent, respectively. In the case of the EU, the figures were 91,000 batches and 62,000 batches, with 91 batches and 135 batches found by the EU to be substandard, making the acceptance rate 99.9 percent and 99.8 percent, respectively. On July 20, 2007, the Ministry of Health, Labor and Welfare of Japan, the largest importer of Chinese food, released an examination report on food imported from China in 2006, which showed that Japan conducted more sample surveys on Chinese food (15.7 percent) than on food from anywhere else, but Chinese food had the highest acceptance rate (99.42 percent), followed by that imported from the EU (99.38 percent) and the US (98.69 percent). The mainland of China is a major supplier of food for the Hong Kong Special Administrative Region. Two large food sample surveys conducted by Hong Kong's Food and Environmental Hygiene Department in the first half of 2007 showed that the acceptance rate stood at 99.2 percent and 99.6 percent, respectively.
(2) Quality of Imported Food Stable
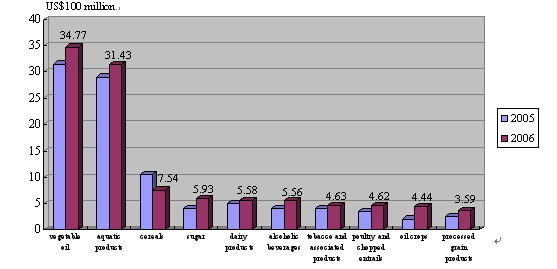
In 2006, China imported 20.273 million tons of food, worth US$13.396 billion, up 37.94 percent and 25.11 percent year on year, respectively. The top ten varieties in terms of import value were vegetable oil, aquatic products, cereals, sugar, dairy products, alcoholic beverages, tobacco and associated products, poultry and chopped entrails, oil crops, and processed grain products. (See Table 7)
Table 7 Top ten food varieties in terms of import value in 2006 as compared with 2005
 |
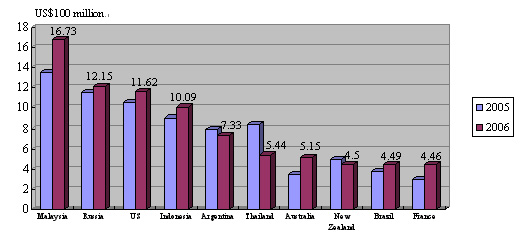
China imports foodstuffs from 143 countries and regions, and the top ten in terms of trade value are Malaysia, Russia, the US, Indonesia, Argentina, Thailand, Australia, New Zealand, Brazil and France. (See Table 8)
Table 8 Top ten countries in terms of China's import value of food in 2006 as compared with 2005
 |
For many years, the quality of food China imports has been fairly stable, and no serious hazard has been caused by imported food. During the period from 2004 to the first half of 2007, the acceptance rate of imported food, according to statistics released by the ports of entry, were 99.29 percent (2004), 99.46 percent (2005), 99.11 percent (2006) and 99.29 percent (first half of 2007), respectively.
