A trade war will cut US living standards
- By John Ross
 0 Comment(s)
 Print
Print E-mail China.org.cn, August 9, 2018

The U.S. media is aware that the Trump administration has only a narrow window of opportunity to attack China in the "trade war" before the situation in the U.S. worsens. The Trump administration aims to use the normal upswing of the U.S. business cycle in 2018 to disguise the pain that U.S. tariffs are causing for the U.S. population, companies, workers and farmers – before a downturn of the U.S. business cycle in 2019-2020 makes that pain more severe.
But even before 2019 a key factor affecting the situation will be rising U.S. inflation and its downward pressure on U.S. wages – as tariffs will worsen inflation. As shown below, this situation is understood in the U.S.
The fundamental economic issue is that Trump's tariffs increase inflationary pressures in the U.S. because:
? A general tariff on a product against all countries (such as the U.S. tariffs on steel and aluminum) raises the price of goods on which tariffs are imposed
? Tariffs against specific countries (such as China) forces importers to buy from more expensive suppliers.
Inflation is politically sensitive for the Trump administration because U.S. wage growth in real money terms is very low. Therefore, even a small increase in inflation, which has appeared recently, has led to real inflation adjusted wages falling – a trend which if continued, will evidently lead to political discontent.
The aim of this article is, therefore, to help assess the effects of the "trade war" in the U.S. by examining inflationary trends in the U.S. and their impact on real incomes.
The state of the U.S. business cycle
The Trump administration's calculation is that it can use the present perfectly normal temporary upswing of the economy to minimize the pain caused to the population and economy by its tariffs. The interrelation of this with the situation of inflation and living standards will be analyzed below. First, however, it is necessary to briefly understand the situation of the U.S. business cycle and its impact on the U.S. economy and politics.
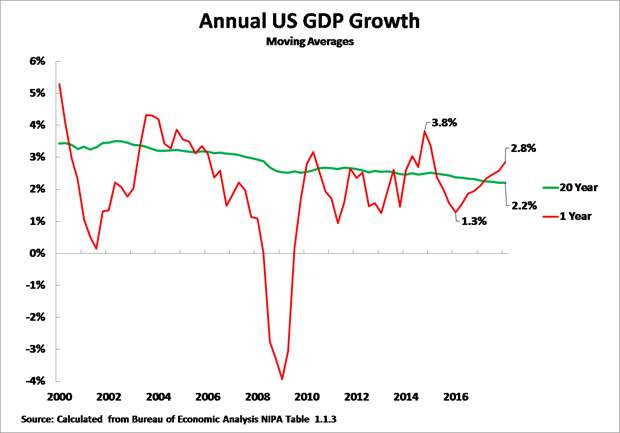
Figure 1, therefore, illustrates the present state of the U.S. business cycle – showing the business cycle oscillations of the economy above and below its long-term average growth rate of 2.2 percent. The crucial thing to note is that after a recent business cycle peak at 3.8 percent in the first quarter of 2015, the business cycle turned downwards, and the economy had an extremely bad performance in 2016 – U.S. GDP growth during that year fell to only 1.3 percent. This extremely poor economic performance in 2016, of course, helps explain Trump's election.
Following this, in a perfectly normal business cycle fashion, after 2016 the U.S. business cycle turned upwards – reaching 2.8 percent year on year growth in the second quarter of 2018. This helps disguise the pain of the tariffs. But the Trump administration's problem is that the business cycle will inevitably turn down again in 2019 or 2020 – which means that the economic pain caused by the tariffs will then be felt more sharply. However, even before this, as analyzed below, the interrelation of rising inflation and low wage growth can cause substantial problems for Trump.
Figure 1

Trends in U.S. money wages
Turning to U.S. wages, it is well known that since the international financial crisis the growth of money wages in the U.S. has been low. Figure 2 shows that the annual increase in money wages, which had reached over 4 percent a year prior to the international financial crisis, fell to only 1.2 percent in 2012. Even after recovery from this very depressed level it reached only 2-2.5 percent for most of the period since. The inevitable effect of such a low growth of U.S. money wages is that any increase in the inflation rate seriously reduces the rate of growth of real inflation adjusted wages – and may even result in real wages falling.
Figure 2

U.S. inflation
Turning to U.S. inflation, the ups and downs in the business cycle in turn create inflation cycles – an upswing of the business cycle normally creating inflation and a downswing of the business cycle lowering the inflation rate. Figure 3 shows this clearly – the large recession of 2008-2009 was accompanied by an actual fall in consumer prices, the economic slowdown in 2015-2016 showed low CPI growth, while inflation was higher in periods of economic expansion.
Figure 3

U.S. real wages
These trends in U.S. inflation interact with slow growth of U.S. money wages to create the trends in U.S. real wages. As can be seen from Figure 4, low inflation in 2015-2016 led to an increase in hourly real wages which reached 2 percent a year, while the increase in inflation in 2017 and 2018 led to a sharp fall in the growth of real wages. By May and June 2018, due to rising inflation, U.S. real wages were falling.
As the Washington Post noted, under the self-explanatory headline "For the biggest group of American workers, wages aren't just flat. They're falling:"
"For workers in 'production and nonsupervisory' positions, the value of the average paycheck has declined in the past year…. The group accounts for about four-fifths of the privately employed workers in America."
Trump is attempting to contain inflation by measures such as putting pressure on Saudi Arabia to lower oil prices against that countries, a typical way the U.S. is attempting to force its allies to subsidize the U.S., but so far this has had no effect in reducing U.S. inflation.
To summarize, while President Trump's administration has been talking about improving the conditions of "working Americans" in fact their real wages have now started to fall.
Figure 4

Tariffs will raise inflation
At this point the issue of tariffs and U.S. real incomes intersects, because tariffs will put upward pressure on U.S. inflation. Some of the inflationary effects of the Trump administration's tariffs are already clear:
? The tariff on washing machines was followed by a 20 percent increase in the price of washing machines and dryers in the U.S.
? The second major tariff introduced was on steel and aluminum. Steel prices were already rising in the U.S. before these tariffs were introduced but the tariffs inevitably significantly deepened this trend. By July 2018 U.S. prices on hot rolled band steel were 52 percent above their level in October 2017.
? Aluminum prices have increased by 11 percent since the beginning of the year.
?The Wall Street Journal noted: "Polaris is raising prices on its… recreational vehicles to cover $15 million of the $40 million in tariff-related costs the Minnesota-based manufacturer expects to pay for foreign-made steel, aluminum and components from China this year."
? Coca Cola, makers of the U.S.' most iconic soft drink, announced it was taking the unusual step of raising prices midyear in North America because of rising costs, including prices for aluminum.
? Caterpillar, the biggest U.S. construction equipment manufacturer, announced that it expected losses of $100-$200 million from tariffs which will clearly put upward pressure on its future prices.
Tariffs on washing machines, which affected $10.3 billion of imports, and on steel and aluminum, affecting $44.9 billion of imports, cover a much smaller range of goods than tariffs affecting $250 billion of imports which have been threatened by the Trump administration against China. The negative inflationary consequences of U.S. tariffs against China on buyers will therefore be more severe – the respected Western analytical firm Oxford Economics calculated that the average U.S. household saved $850 a year due to the cheap price of imports from China.
Conclusion
These trends show clearly why the U.S. inflation data is crucial to follow. The U.S. media is well aware it is one of the main constraints on Trump and poses a serious risk of political unpopularity. As the Wall Street Journal noted under the headline "Trump's Narrow Window for Trade Wins in China," with the subheading "US leverage in its trade dispute with China may be close to its peak:"
"On the U.S. side, salad days of 4 percent growth and 2 percent inflation look hard to sustain... Consumer price inflation, already hovering around the Federal Reserve's target of 2 percent, may not be far behind. And the next tranche of threatened tariffs will hit industries that China dominates, meaning finding alternative suppliers to alleviate an upward squeeze on prices will be tougher. China supplies over 50 percent of U.S. imports across the affected sectors, according to Capital Economics.
"President Trump's window for a favorable deal with China is a narrow one. Investors should look for breakthroughs by early 2019 – or not at all."
It is for this reason that Trump has to attempt to go fast in his attacks on China. The current upturn of the U.S. business cycle, as always, will be temporary and inflation is already starting to rise, worsened by the tariffs – putting downward pressure on wages.
The Trump administration therefore calculates that it has a window of opportunity in the second half of 2018 and the beginning of 2019 to put pressure on China. After that the pain of Trump's tariffs on the U.S. population and on U.S. companies, workers and farmers will become worse.
For China, of course, the situation is the exact opposite. If U.S. inflation rises in late 2018, and as the business cycle turns downwards in 2019-2020, China's position will strengthen.
John Ross, Senior Fellow, Chongyang Institute for Financial Studies, Renmin University of China, is a columnist with China.org.cn. For more information please visit:
http://m.keyanhelp.cn/opinion/johnross.htm
Opinion articles reflect the views of their authors, not necessarily those of China.org.cn.


